Why you should profile your game early
I think a lot of devs think of profiling and performance optimization as something you do once, towards the very end of development. People love the quote "Premature optimization is the root of all evil".
The source of the quote is Donald Knuth's 1974 paper "Structured Programming with go to Statements". You've maybe heard of Knuth before as the author of "The Art Of Computer Programming" book series. Smart guy, if he said it, surely he's right!
Well, I do think he's right. But that quote isn't actually what he said. It's part of a larger, and more nuanced statement. The usual, a short punchy sentence with an extreme conclusion is much better at spreading than a full and nuanced paragraph. Knuth's paper is lengthy and talks about a lot of other things, so I'll spare you the trouble and show you what I think is the most important context:
"There is no doubt that the grail of efficiency leads to abuse. Programmers waste enormous amounts of time thinking about, or worrying about, the speed of noncritical parts of their programs, and these attempts at efficiency actually have a strong negative impact when debugging and maintenance are considered.
We should forget about small efficiencies, say about 97% of the time: premature optimization is the root of all evil. Yet we should not pass up our opportunities in that critical 3%.
A good programmer will not be lulled into complacency by such reasoning, he will be wise to look carefully at the critical code; but only after that code has been identified. It is often a mistake to make a priori judgments about what parts of a program are really critical, since the universal experience of programmers who have been using measurement tools has been that their intuitive guesses fail.
After working with such tools for seven years, I've become convinced that all compilers written from now on should be designed to provide all programmers with feedback indicating what parts of their programs are costing the most; indeed, this feedback should be supplied automatically unless it has been specifically turned off."
A very different idea! 97% of code ends up being irrelevant to performance. BUT there's a critical 3% that matters a lot to performance, and needs to be optimized. The programmer's job is to analyze their program as they are writing it, keeping in mind which parts are critical to performance.
In this view, "premature optimization" definitely doesn't mean "profile and optimize your software somewhere towards the end of development". It means "don't optimize before you profile".
That doesn't necessarily mean you need to optimize every slow hot-path that you find, but it does mean you should at least consider it. I'd break it down into these categories:
1) Code that is not very relevant to bottom line performance
Stuff that happens on a light workload, or is far from any code hot-paths. The 97% of stuff that doesn't matter that much. Generally don't worry about these.
2) Code that is relevant to bottom line performance, and is foundational
By "foundational" I mean "is this a module of code that the rest of the program is built on top of". Something that, if you had to majorly rewrite it in the future, you would be forced to also majorly rewrite things built on top of it. A good example is your entity system in a game, and how you handle the memory of your entities. If you need to rewrite something like this late into development you'll have to rewrite half your project with it.
For foundational code like this, worry about performance very early on. It's fine to have a prototype phase where you do something quick and easy to explore some gameplay ideas. But once you decide on turning your prototype into a real thing, scrap the prototype and build a solid foundation instead.
3) Code that is relevant to bottom line performance, but isn't foundational
These are expensive systems that happen to be "leaf" nodes in your software. No other major systems depend on them. Alternatively, if other systems do depend on them, they happen to be very modular systems, where implementation can get swapped out easily without changing the way they interface with other systems.
These are systems where you can wait and see. For games in particular, I think you should wait and see. Games have particularly volatile structure across development. Features get built and scrapped and revamped. Because of that volatility, it makes a lot more sense to optimize later on. Time spent optimizing a system that ultimately gets scrapped, is time wasted.
It's important to note, that code might change categories over time. If your design evolves sufficiently, something in category 3 might go into category 2. Something from 1 might evolve into something from 3. This is part of why it's important to profile as you go. If you've profiled, you will notice when something from category 3 is shifting into 2, and you'll be able to act accordingly. If you haven't profiled, you'll do that change blindly, and you'll miss the ship for optimizing what is now a foundational module.
Performance Budget Management
Beyond all of the above, there's another reason why you should be profiling as you go. For most software, you likely have a certain compute budget you have to stay within. The common case for games is wanting to stay within 60fps for all target platforms, or at the very least 30fps.
That gives you a hard limit on the resources you have to work with. Profiling on your target hardware as you go lets you know how much you've spent of that. Knowing roughly what systems you could optimize, and by roughly how much, lets you know how much you could free from your existing budget by doing an optimization pass.
That's important information to keep in mind whenever you're considering adding a new system, or expanding an existing one. Spending time on building some new expensive gameplay system might be cool, but you should probably shy away from it if you know you're already nearing the limit of your CPU performance budget. Some cool new post-processing stack might also be something nice to add, but you should avoid it if your GPU performance budget is almost finished, with few actionable optimizations left in sight.
Conversely, if you're close to your limit but know there are plenty of optimizations you can make, the above features once again become a possibility.
That's hopefully enough work trying to convince you. Let's move on to some practical stuff. How do you actually profile your game? Donald Knuth probably built his own tools to profile his software. We can be a bit lazier today, there's existing tools we can use, and they're pretty good.
Unity Profiling
Most Unity users are probably familiar by now with a couple of the in-built profiling tools. Maybe the main "Unity Profiler". Maybe the "Frame Debugger" as well. There's more of them, although lesser known. I think they can be a good bit more useful than their more popular brothers.
There's also third party, non-unity specific tools you can use. Those too, I think are often more useful than the stock unity tooling.
The below section isn't really meant to be a tutorial. It's meant to be a quick entry-point to learn about what tools are available, and what you might use them for. Once you pick one out, you'll find documentation and tutorials to learn the ropes.
I won't cover every tool under the sun either, just some of the things I've found use for. I also won't cover any console-specific, or mobile-specific tools. The unity docs have a useful page covering more of these: Performance profiling tools.
1. Unity Profiler
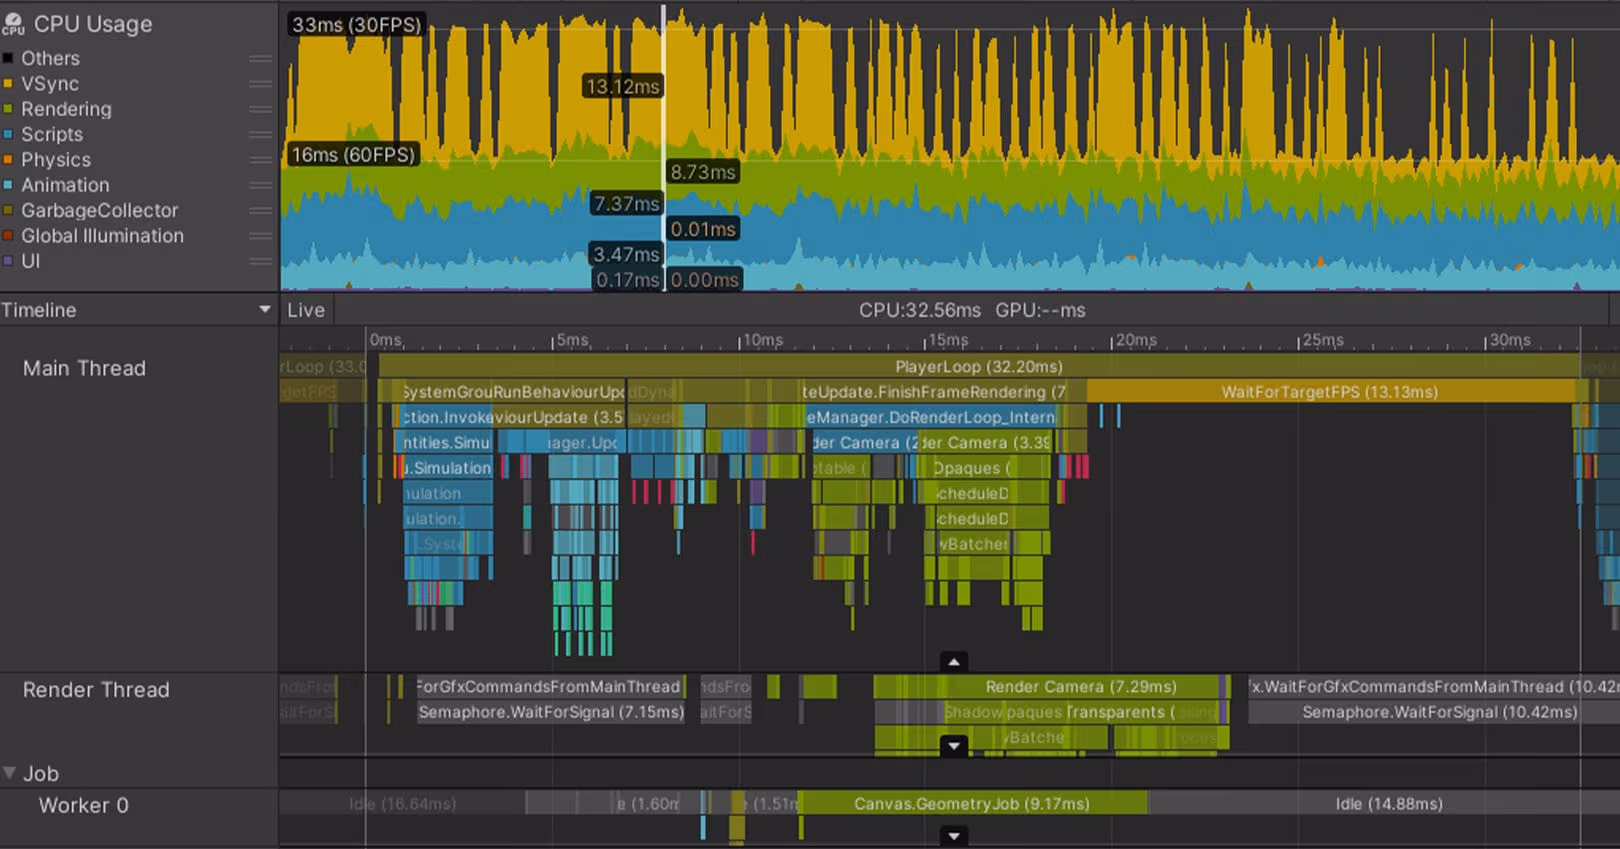
The basic package! It can get you quite far on its own. I would say this should be your starting point for most profiling. It'll give you a decent overview of everything your game is doing. You can get a starting view of your CPU performance, with breakdowns of your own scripts and unity systems, it'll tell you a bit about rendering, and a bit about memory. Deep profiling mode gives some more detail as well.
It often won't have all the details you need when digging down to actually optimize things, but it will tell you enough to know what to look for with one of the more specific tools.
2. Frame Debugger
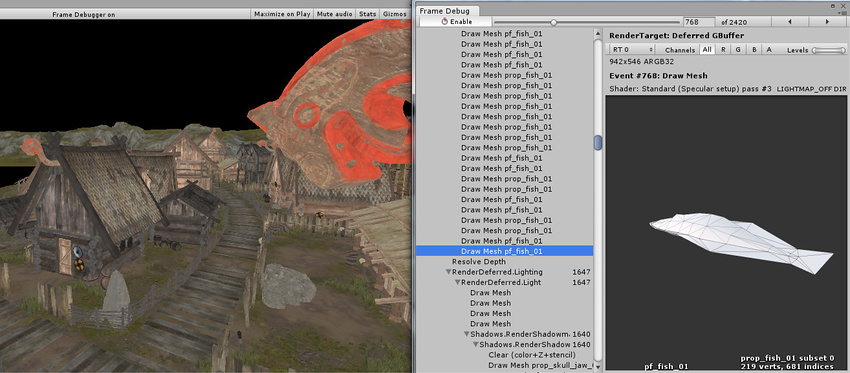
A staple for rendering analysis. Lets you step through draw calls one by one, watching your frame being built step by step. If your batching is broken, this is where you'll first notice that. If your models are weird and being constructed out of 500 separate draw calls, this is where you'll notice that.
3. Memory Profiler
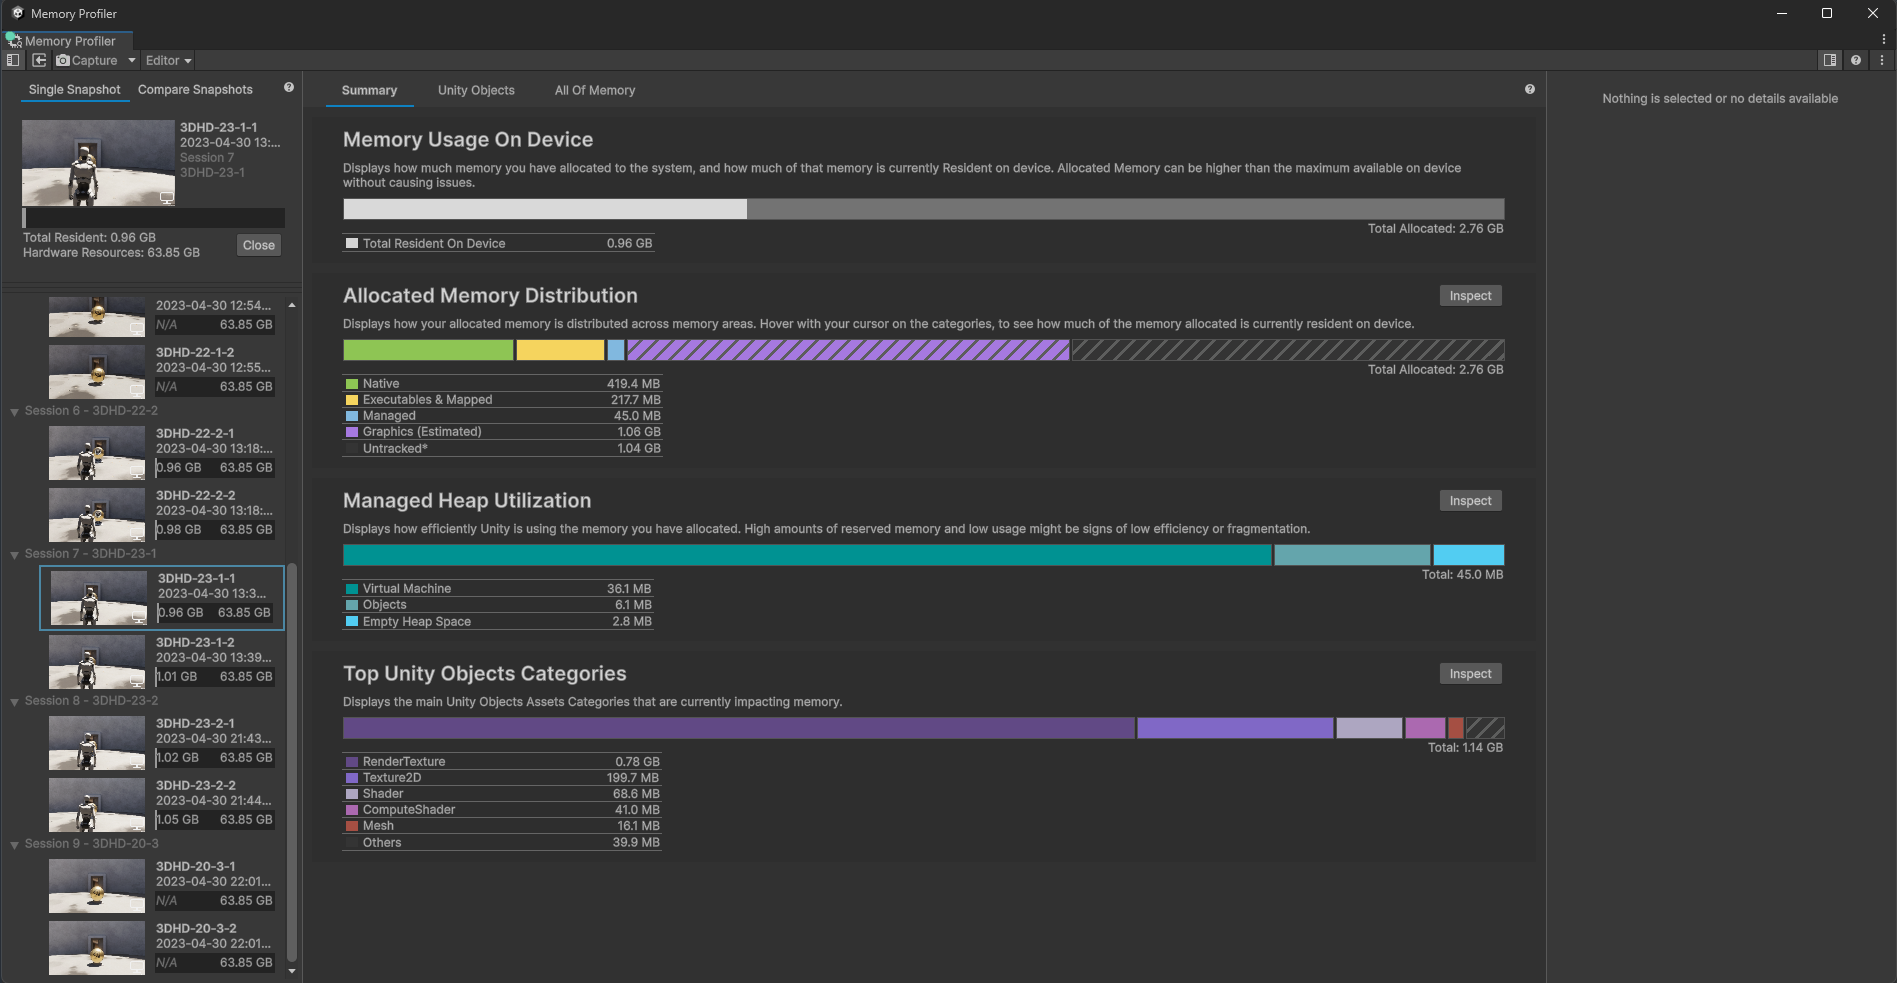
Offers a lot more detail than the in-built profiler about what your memory is doing. Very useful for debugging memory leaks as well. There's a good chance it won't be able to track every single chunk of memory you're using, but it should get you pretty far.
4. Profile Analyzer
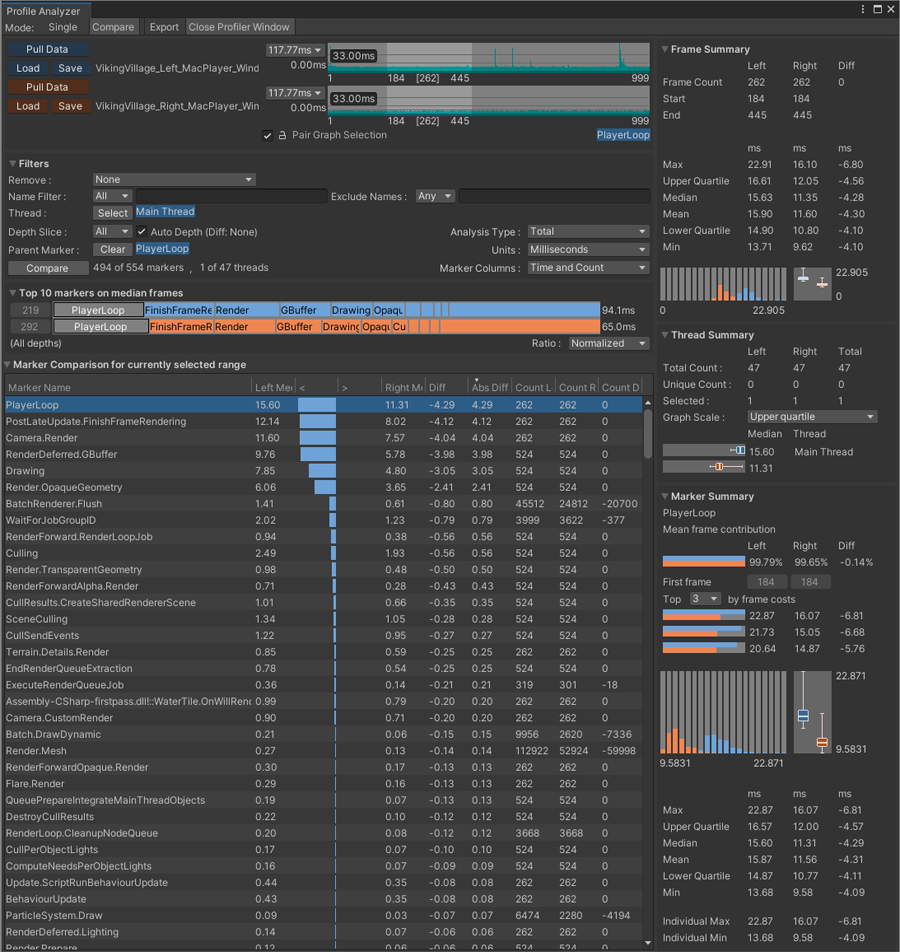
At some point you'll likely have to deal with frame spikes. Most of your frames are good, but some are slow for some reason. The profile analyzer is built around contrasting and aggregating data about multiple frames. This is very useful when trying to find inefficiencies that only happen sometimes.
5. RenderDoc
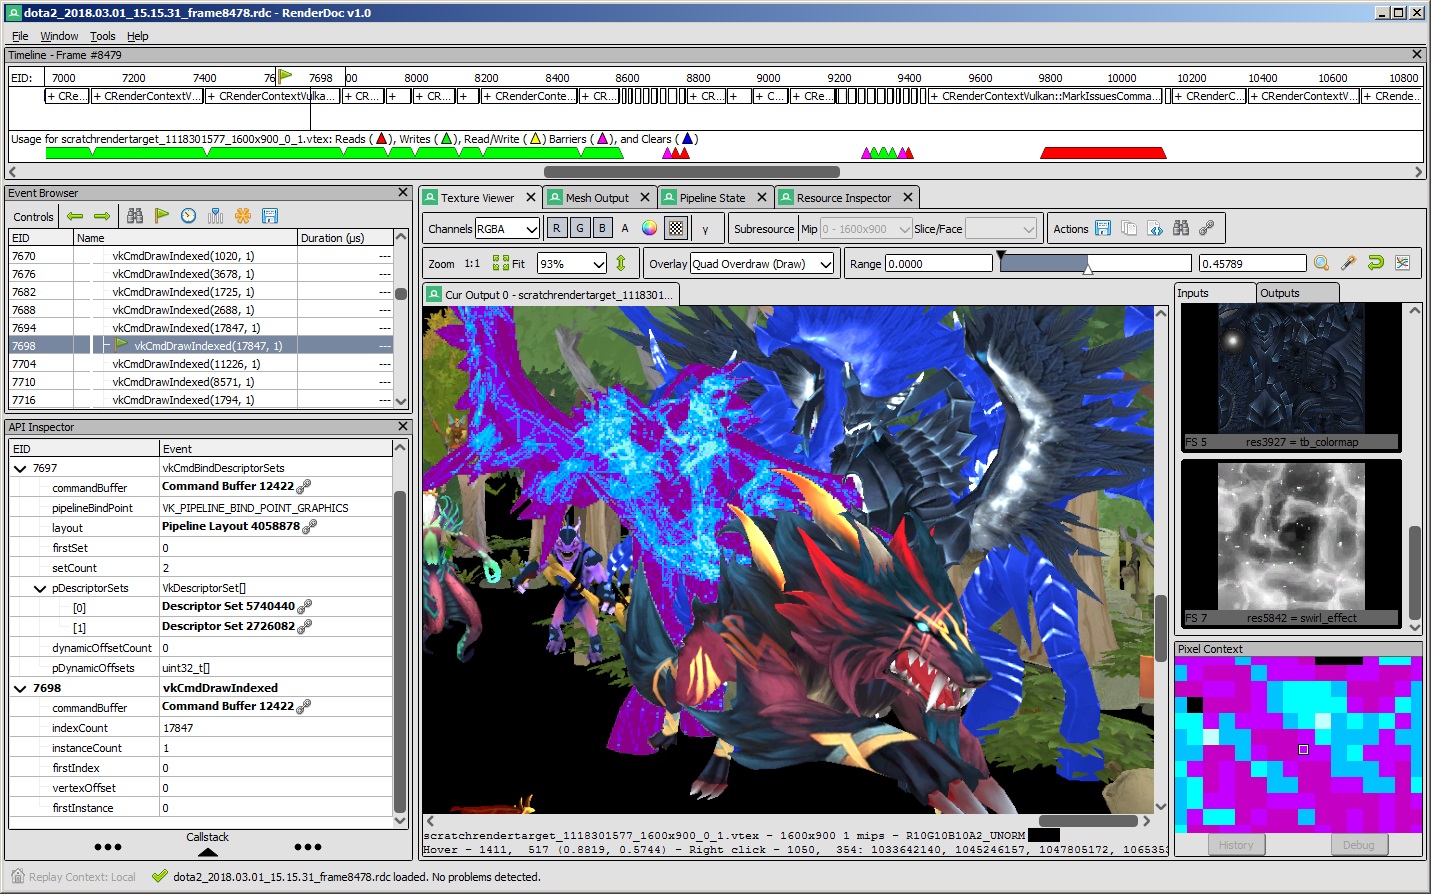
The unity frame debugger is a good starting point, but one thing it doesn't do is estimate cost of individual draw calls. RenderDoc does that, and in general allows you to dig a lot deeper into what the GPU is doing at each draw call. If you're still GPU bottlenecked after cutting out unnecessary draw calls and obvious fluff, this is what you can use to optimize further. It's open source under the MIT license as well. Great tool!
There's a lot of other tools out there, including some good paid ones like Superluminal. The above are likely enough to find the important issues in your game, if used well. Once you get the hang of it, it won't take you that much time to use them periodically and check in on your performance. It'll save you a lot of trouble in the long run.
Links: